- August 27, 2022
IOTA Price Forecast: IOTA breaks out bearishly

The IOTA price could not maintain the parallel upward channel, but broke out bearishly. Is the IOTA price bouncing again now?
In the last IOTA course forecast we wrote“”In the short term, the IOTA price could move back to around 0.32 USD and if this support breaks, IOTA will find significant Fibonacci support at around 0.28 USD at the latest. In addition, the MACD is also bearish in the 4H chart.”
IOTA price fell to the Golden Ratio support at around $ 0.28 and bounced off it
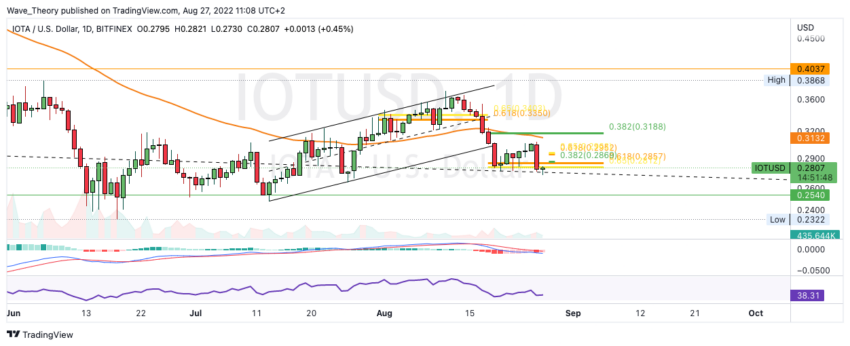
The IOTA price could not maintain the parallel upward channel, but broke out bearishly. In the course of this, the IOTA price broke the 50-day EMA and fell to the Golden Ratio support at around $ 0.28. There, the IOTA price was able to bounce strongly and rose to around 0.3085 USD.
Subsequently, however, the strong sale took place, from which IOTA was not spared. This means that IOTA is now once again at the Golden Ratio support at around 0.28 USD. In addition, just below it runs the middle line of the parallel downward channel, which is visible in the monthly chart.
Furthermore, the MACD lines are bearishly crossed, while the histogram ticked bearishly lower yesterday, but seems to be ticking bullish higher today. The RSI is neutral.
If the IOTA price should now bounce off the Golden Ratio support at around 0.28 USD again, significant Fib resistances are already waiting for IOTA at around 0.287 USD and 0.3 USD. Otherwise, the 50-day EMA acts as a significant resistance at around $ 0.313.
A death cross was established in the 4H chart
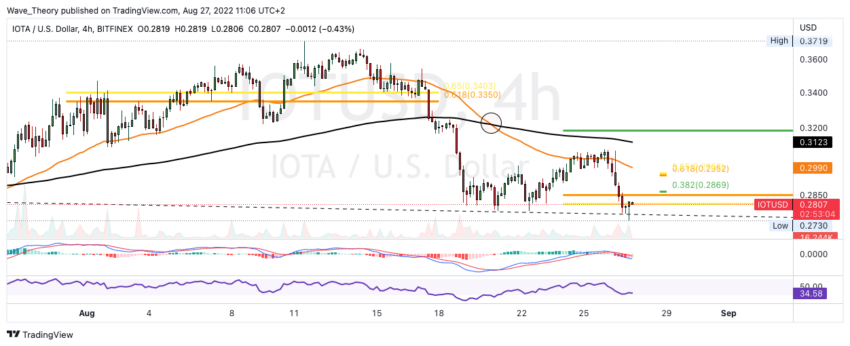
Also in the 4H chart, the MACD gives mixed signals, because the MACD lines are crossed bearishly while the histogram ticks bullish higher. In addition, the RSI is also neutral here.
In addition, a death cross has established itself in the 4H chart, which confirms the trend bearish in the short term.
The MACD’s histogram is ticking bearishly lower on the weekly chart
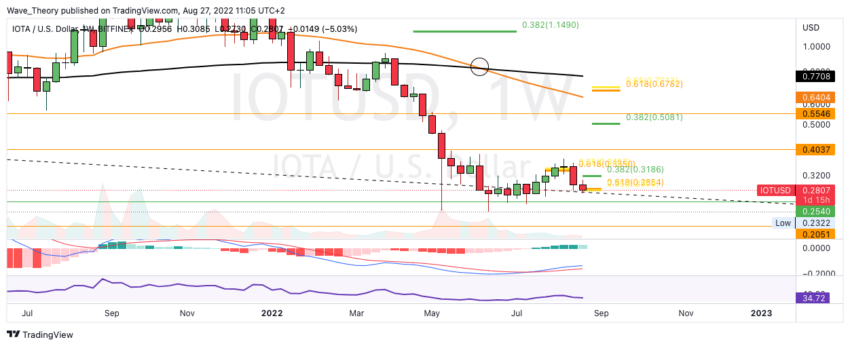
A death cross can also be seen in the weekly chart, which also confirms the trend bearishly in the medium termT. In addition, a bearish rejection at the Golden Ratio resistance at around $ 0.34 can be seen in the weekly chart, which confirms the bearish trend.
The MACD lines, on the other hand, are still crossed bullish, but the histogram of the MACD could close bearishly lower this week. If the IOTA price does not bounce back from the Golden Ratio support at around $ 0.28, IOTA could return to support between $0.205 and $0.254.
IOTA price trend remains strongly bearish in the long term
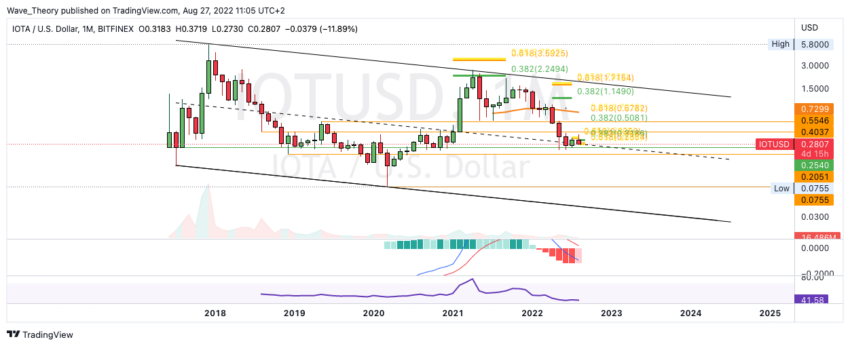
In the monthly chart it becomes clear that IOTA in a bear trend since 2018 occupying. There is also a parallel downward channel starting. Nevertheless, the MACD’s histogram is ticking bullish higher this month and if it closes bullish in a few days, this would be a first indication of a possible bullish trend reversal.
Against BTC, the IOTA price is moving between Fib resistance and support
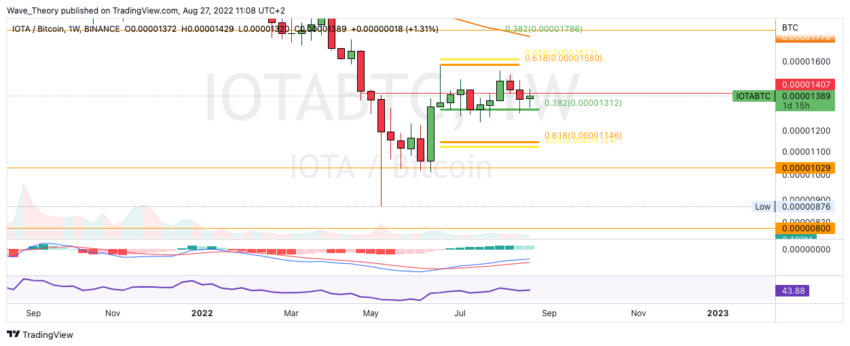
Also against BTC, the histogram of the MACD in the weekly chart begins to tick bearishly lower. However, the MACD’s histogram has been ticking bearishly lower since last week. However, the MACD lines are still crossed bullish. In addition, the RSI is also neutral here and gives neither bearish nor bullish signals.
Currently, the IOTA price is moving between Golden Ratio resistance at around 0.0000158 BTC, where IOTA was rejected, and the 0.382 Fib support at around 0.00001312 BTC. If IOTA breaks this support bearishly, the next significant Fibonacci support is waiting at around 0.0000114 BTC.
On the other hand, if IOTA breaks the Golden Ratio resistance bullish at around 0.0000158 BTC, significant Fibonacci resistance awaits at around 0.00001786 BTC. In addition, just below the 50-week EMA runs, which also acts as resistance.
Disclaimer
All information contained on our website is researched to the best of our knowledge and belief. The journalistic articles are for general information purposes only. Any action taken by the reader on the basis of the information found on our website is done exclusively at his own risk.