- August 28, 2022
Gold price Forecast: Gold bearishly rejected at Golden Ratio


Since the last gold price forecast in May, the gold price has fallen around 8%. In addition, the gold price has now been rejected bearishly.
The gold price corrected to the 50-month EMA
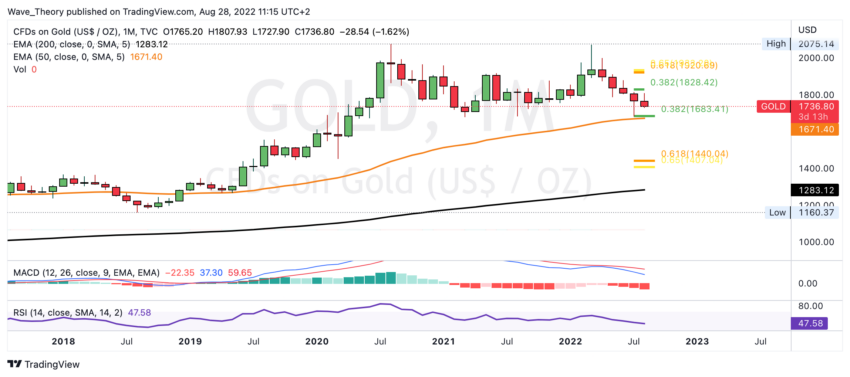
The gold price has been in a strong downward movement since gold peaked at around $ 2,075. This is the fifth month in a row that gold has been in a downward movement. The gold price returned to the 50-month EMA at just under $ 1,680 last month. Gold was able to bounce there at first, but in the monthly chart the trend remains clearly bearish.
For an end to the correction, gold must break the Golden Ratio resistance at around $1,930. In addition, the MACD is clearly bearish on the monthly chart, while the RSI is neutral. The MACD lines remain bearishly crossed and the histogram has been ticking bearishly lower for several months. The RSI will soon reach oversold regions.
Gold price was bearishly rejected at Golden Ratio resistance at around 1,800 USD
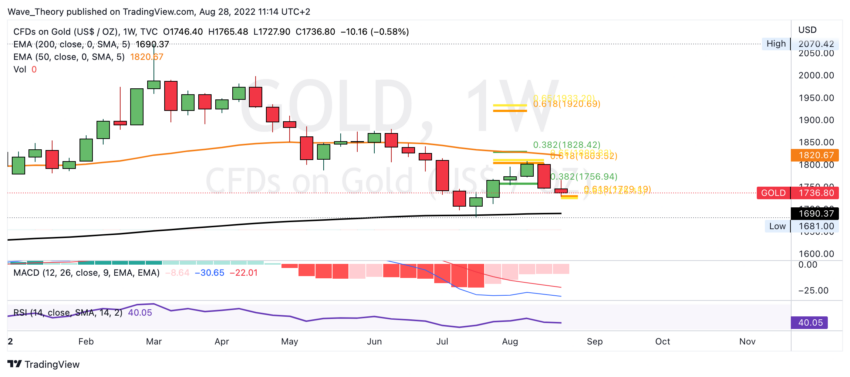
After the gold price had established a local low at around 1.681 USD, the gold price was able to $1,800 rise. However, the gold price was rejected bearishly very strongly at the Golden Ratio resistance.
In addition, the MACD lines on the weekly chart are bearishly crossed, while the RSI is neutral. However, the histogram of the MACD has been ticking bullish higher for several weeks.
Gold price could bounce bullish at around $1,730
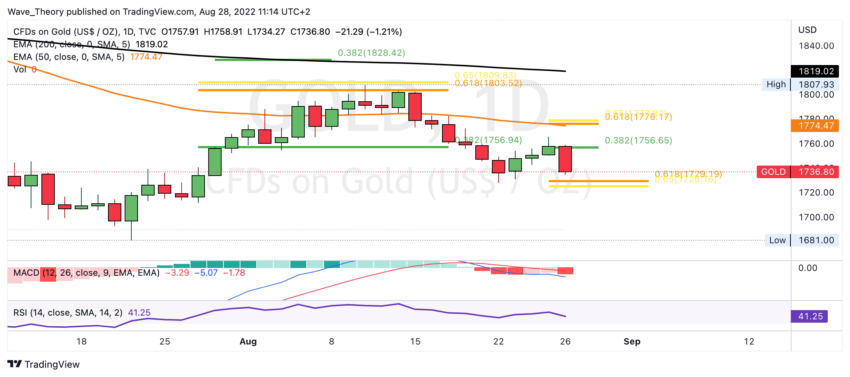
In the daily chart, the MACD lines are crossed bearishly and the histogram of the MACD ticks bearishly lower. The RSI gives neither bullish nor bearish signals.
Gold could now bullish bounce off the Golden Ratio support at around $1,730 to target the next Fib resistance at around $1,760. Otherwise, the gold price will remain in a bearish trend until gold overcomes the Fib resistance at around $ 1,930.
Bitcoin and Gold forms slightly offset extreme points
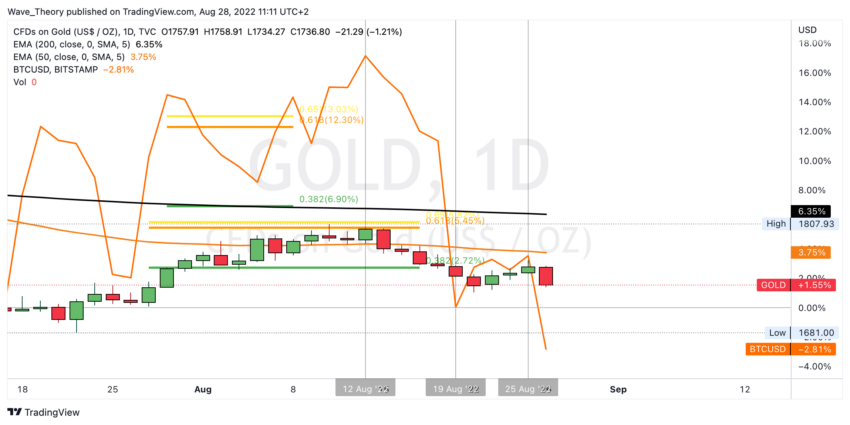
Gold reached a local high point two days before the Bitcoin price, and then rose sharply. Bitcoin formed a low point a day before gold, then formed a local high point on the same day and continued the downtrend.
Disclaimer
All information contained on our website is researched to the best of our knowledge and belief. The journalistic articles are for general information purposes only. Any action taken by the reader on the basis of the information found on our website is done exclusively at his own risk.