- August 28, 2022
FTX Price Forecast: FTT price could now bounce off bullish

The FTX exchange coin FTT is now at Golden Ratio support, against which the FTT price could bounce bullish.
In the last FTT price forecast, we wrote: “The FTT price could rise despite the bullish outlook in the monthly chart correct it in the short term. FTT will take place at around 28 USD and at around 25 USD significant Fibonacci supports. The Low point at around 21 USD also serves as a support, but may remain untouched.”
FTT price falls to the Golden Ratio support at around 25 USD
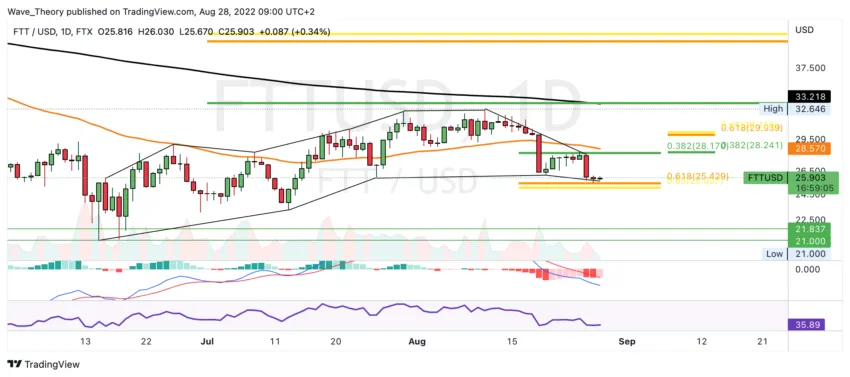
In fact, the FTT price fell very sharply to reach the Golden Ratio support at around $ 25. There, the FTT price could now bounce off to rise to the next Fib resistance at around 28.2 USD. However, the correction remains intact unless the FTT rate overcomes the golden ratio at around USD 30.
In addition, with this price downturn, the FTT price formed a lower low point and a lower high point, thus breaking the series of higher low and high points. However, the histogram of the MACD is ticking bullish higher on the daily chart today, after it had ticked bearishly lower the last two days. The MACD lines are crossed bearishly.
In contrast to the more bearish MACD, the RSI forms a bullish divergence.
In the 4H chart, the Death Cross confirms the trend bearish in the short term
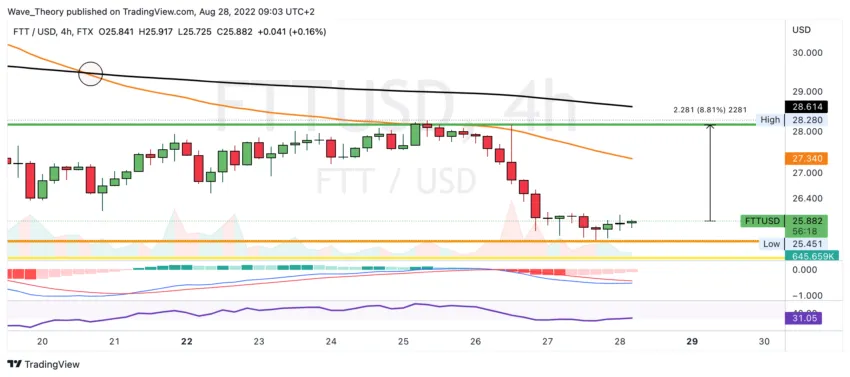
Also in the 4H chart there are bullish signals. Thus, the histogram of the MACD ticks bullish higher and the MACD lines are on the verge of a bullish crossover. The FTT price could rise by around 9%.
Otherwise, a death cross was established, which confirms the trend bearish in the short term.
What happens if the FTX token does not bounce off the Golden Ratio support?
If the FTT price does not bounce bullish now, but breaks the Golden Ratio support at around $ 25 bearish, significant support is waiting for the FTX token between $ 21 and $ 22 again. In addition, the histogram of the MACD has been ticking bearishly lower since last week and the MACD lines could now cross bearishly.
The RSI is neutral and gives neither bullish nor bearish signals.
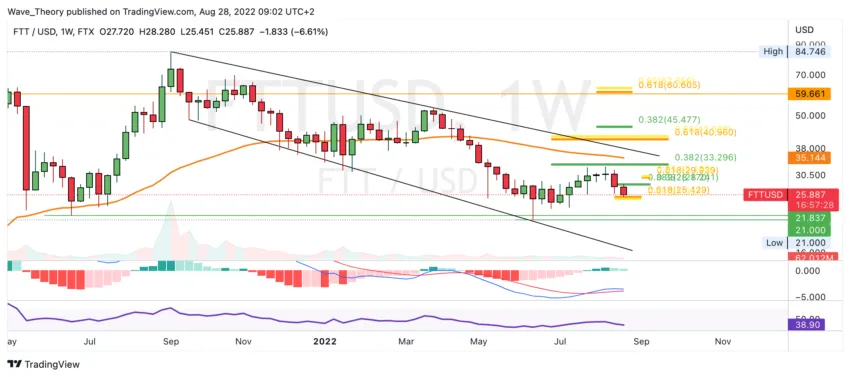
In the monthly chart, the trend is still bearish
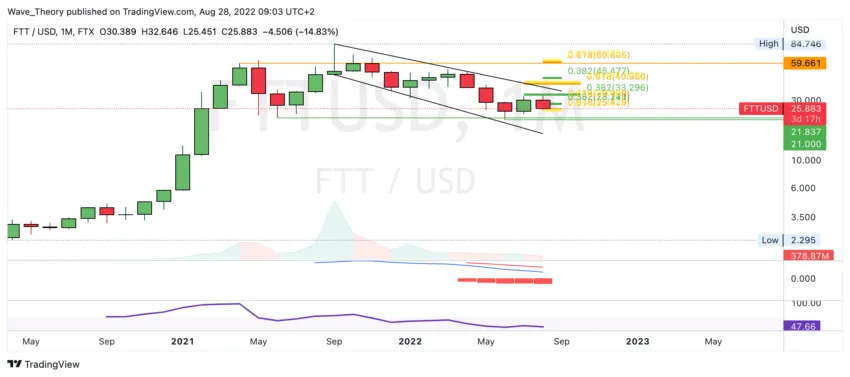
The FTX price has been in a bear trend since mid-2021. In addition, the histogram of the MACD in the monthly chart ticks bearishly lower and the MACD lines remain bearishly crossed. In the medium term, the FTT rate could return to the last low at around 21 USD.
Against BTC, the FTT price could break out bullish or bearish
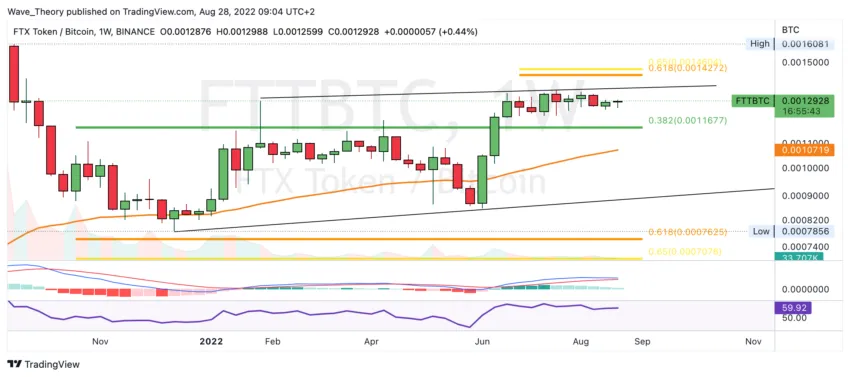
Against BTC, the histogram of the MACD in the weekly chart is also ticking bearishly lower, while the MACD lines are on the verge of a bearish crossover. The FTT price moves sideways with a slight upward slope. At around 0.00143 BTC, significant resistance awaits the FTX token price.
Towards the bottom, the FTX Coin finds significant support at around 0.001167 BTC.
Disclaimer
All information contained on our website is researched to the best of our knowledge and belief. The journalistic articles are for general information purposes only. Any action taken by the reader on the basis of the information found on our website is done exclusively at his own risk.